Difference between revisions of "Reports"
Jump to navigation
Jump to search
Jrobertson (talk | contribs) |
Jrobertson (talk | contribs) |
||
| Line 5: | Line 5: | ||
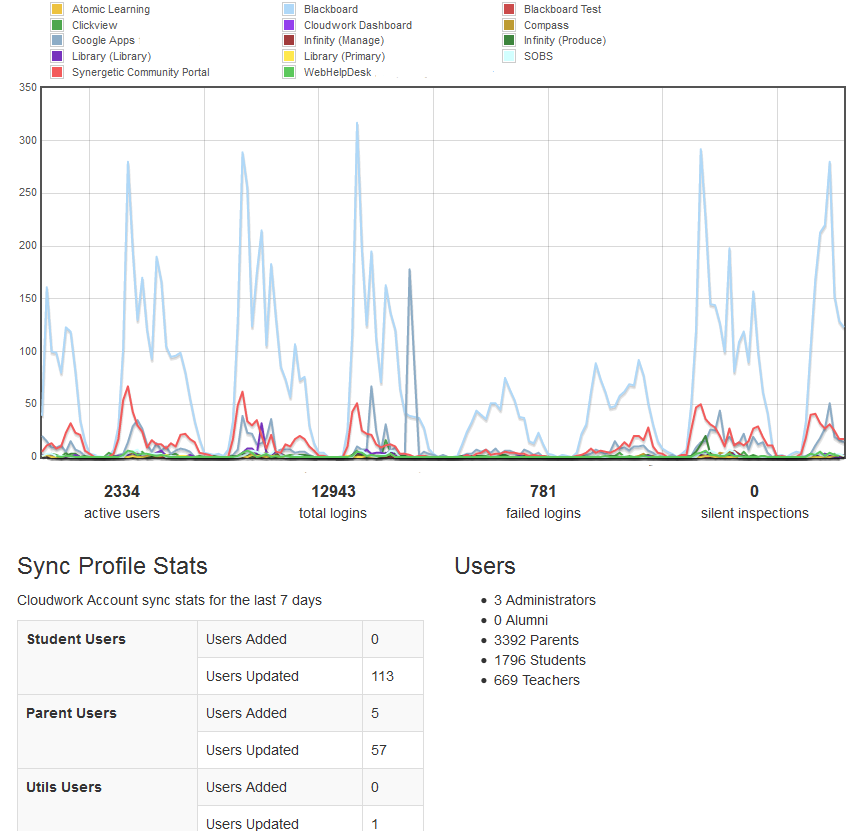
This is the graphical representation of the activity that has been happening over the past 7 days. You can see trends of when people are logging in and when. Synchronisation stats are included to show you what has been updated for each Sync Profile. An example of this page is below: | This is the graphical representation of the activity that has been happening over the past 7 days. You can see trends of when people are logging in and when. Synchronisation stats are included to show you what has been updated for each Sync Profile. An example of this page is below: | ||
| − | [[File:Reports.png| | + | [[File:Reports.png|700px]] |
Revision as of 00:31, 21 November 2017
Reports are designed to give you as an administrator an overview as to what systems are being most frequently used and what activity has been going on in the system.
Summary
This is the graphical representation of the activity that has been happening over the past 7 days. You can see trends of when people are logging in and when. Synchronisation stats are included to show you what has been updated for each Sync Profile. An example of this page is below:
